top of page


TERRASTで投資家・銀行・企業を繋ぎ、
ESG経営を加速する
「データを見たい側」と「データを見せたい側」を繋ぎ
信頼のあるESG情報の循環を実現します。

国内最大級のESGデータ集計・分析・開示のための
各種ソリューション
_edited.png)


サービス提供フローを表します
データ提供フローを表します
目的別にソリューションを探す
業種や課題に応じた最適なESG対応を支援します

.png)


ご支援実績
TERRASTブランドは、これまでESGに関わるさまざまなクライアントへのご支援実績がございます。
※2025年4月時点
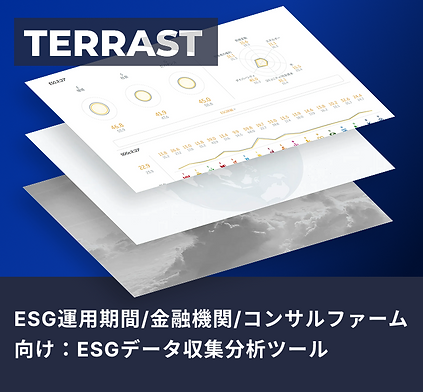
ESG投資を実施する
運用機関・金融機関
大手・準大手を中心に
20
社以上
東証プライム企業
50
社以上
グローバル大手企業
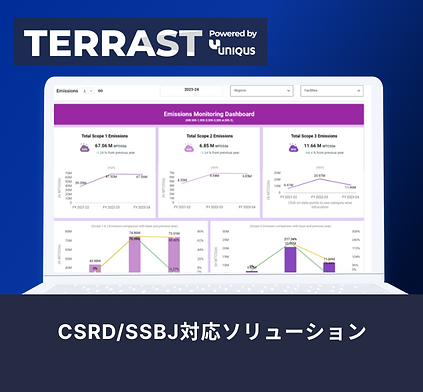
CSRD/SSBJ対応ソリューション
30
社以上
地域金融機関
10
行以上
地場中堅中小企業
2,500
社以上

レポーティングで対応可能な主な基準 ( 随時追加予定 )
各国の開示基準・フレームワーク

ESG評価機関


bottom of page